Tutoriel d3.js
Tutoriel 1 : Graphique vide
Code
tutoriel_01.html<!DOCTYPE html> <html> <head> <script src="d3.v2.js"></script> <style> .graph { background-color: #eeeeee; border: 1px solid black; } </style> </head> <body> <h1>Tutoriel 1</h1> <div id="graph"></div> <script> var graph; var w, h; w = 800; h = 400 // add graph graph = d3.select("#graph") .append("svg:svg") .attr("class", "graph") .attr("width", w) .attr("height", h) .append("svg:g"); </script> </body> </html>
Résultat
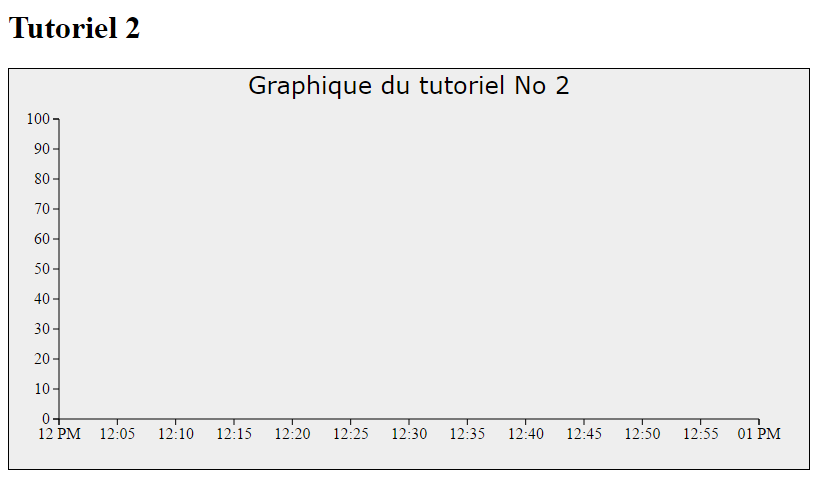
Tutoriel 2 : Titre et Axes
Code
tutoriel_02.html<!DOCTYPE html> <html> <head> <script src="d3.v2.js"></script> <style> .graph { background-color: #eeeeee; border: 1px solid black; } .axis line { stroke: #000000; } .axis path { stroke: #000000; fill: none; } .title { font-family: Verdana; font-size: 24px; } </style> </head> <body> <h1>Tutoriel 2</h1> <div id="graph"></div> <script> var graph; var wImage, hImage, wGraph, hGraph, marginLeft, marginBottom, marginTop, marginRight; var startDate, endDate; var yMin, yMax; var title; wImage = 800; hImage = 400; marginLeft = 50; marginBottom = 50; marginTop = 50; marginRight = 50; wGraph = wImage - marginLeft - marginRight; hGraph = hImage - marginTop - marginBottom; title = "Graphique du tutoriel No 2"; startDate = new Date(2016, 04, 01, 12, 0, 0, 0); endDate = new Date(2016, 04, 01, 13, 0, 0, 0); yMin = 0.0; yMax = 100.0; // add graph graph = d3.select("#graph") .append("svg:svg") .attr("class", "graph") .attr("width", wImage) .attr("height", hImage) .append("svg:g"); // Add the x-axis. xScale = d3.time.scale().domain([startDate, endDate]).range([0, wGraph]); xAxis = d3.svg.axis().scale(xScale).orient("bottom"); graph.append("svg:g") .attr("class", "axis") .attr("transform", "translate("+marginLeft+","+(marginTop+hGraph)+")") .call(xAxis); // Add the y-axis yScale = d3.scale.linear().domain([yMin, yMax]).range([hGraph, 0]); yAxis = d3.svg.axis().scale(yScale).orient("left"); graph.append("svg:g") .attr("class", "axis") .attr("transform", "translate("+marginLeft+","+marginTop+")") .call(yAxis); // titre graph.append("text") .text(title) .attr("class", "title") .attr("x",wImage/2) .attr("text-anchor", "middle") .attr("y",marginTop/2) .attr("fill", "black"); </script> </body> </html>
Résultat
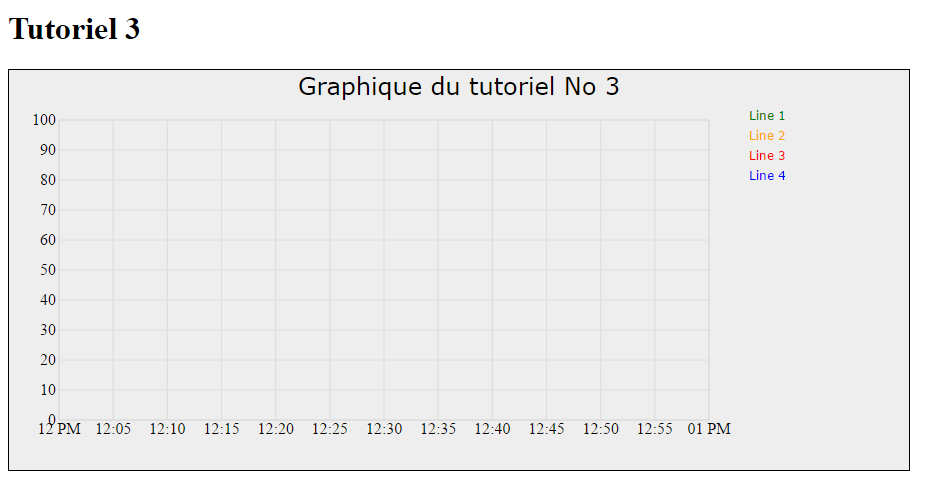
Tutoriel 3 : Grille et légende
Code
tutoriel_03.html<!DOCTYPE html> <html> <head> <script src="d3.v2.js"></script> <style> .graph { background-color: #eeeeee; border: 1px solid black; } .axis line { stroke: #dddddd; } .axis path { stroke: #dddddd; fill: none; } .title { font-family: Verdana; font-size: 24px; } .legend { font-family: Verdana; font-size: 12px; } </style> </head> <body> <h1>Tutoriel 3</h1> <div id="graph"></div> <script> var graph; var wImage, hImage, wGraph, hGraph, marginLeft, marginBottom, marginTop, marginRight; var startDate, endDate; var yMin, yMax; var title; wImage = 900; hImage = 400; marginLeft = 50; marginBottom = 50; marginTop = 50; marginRight = 200; wGraph = wImage - marginLeft - marginRight; hGraph = hImage - marginTop - marginBottom; title = "Graphique du tutoriel No 3"; startDate = new Date(2016, 04, 01, 12, 0, 0, 0); endDate = new Date(2016, 04, 01, 13, 0, 0, 0); yMin = 0.0; yMax = 100.0; // add graph graph = d3.select("#graph") .append("svg:svg") .attr("class", "graph") .attr("width", wImage) .attr("height", hImage) .append("svg:g"); // Add the x-axis. xScale = d3.time.scale().domain([startDate, endDate]).range([0, wGraph]); xAxis = d3.svg.axis().scale(xScale).orient("bottom").tickSize(-hGraph); graph.append("svg:g") .attr("class", "axis") .attr("transform", "translate("+marginLeft+","+(marginTop+hGraph)+")") .call(xAxis); // Add the y-axis yScale = d3.scale.linear().domain([yMin, yMax]).range([hGraph, 0]); yAxis = d3.svg.axis().scale(yScale).orient("left").tickSize(-wGraph); graph.append("svg:g") .attr("class", "axis") .attr("transform", "translate("+marginLeft+","+marginTop+")") .call(yAxis); // titre graph.append("text") .text(title) .attr("class", "title") .attr("x",wImage/2) .attr("text-anchor", "middle") .attr("y",marginTop/2) .attr("fill", "black"); // legende graph.append("text") .text("Line 1") .attr("class", "legend") .attr("x",wImage - marginRight + 40) .attr("y",marginTop) .attr("fill", "green"); graph.append("text") .text("Line 2") .attr("class", "legend") .attr("x",wImage - marginRight + 40) .attr("y",marginTop+20) .attr("fill", "orange"); graph.append("text") .text("Line 3") .attr("class", "legend") .attr("x",wImage - marginRight + 40) .attr("y",marginTop+40) .attr("fill", "red"); graph.append("text") .text("Line 4") .attr("class", "legend") .attr("x",wImage - marginRight + 40) .attr("y",marginTop+60) .attr("fill", "blue"); </script> </body> </html>
Résultat
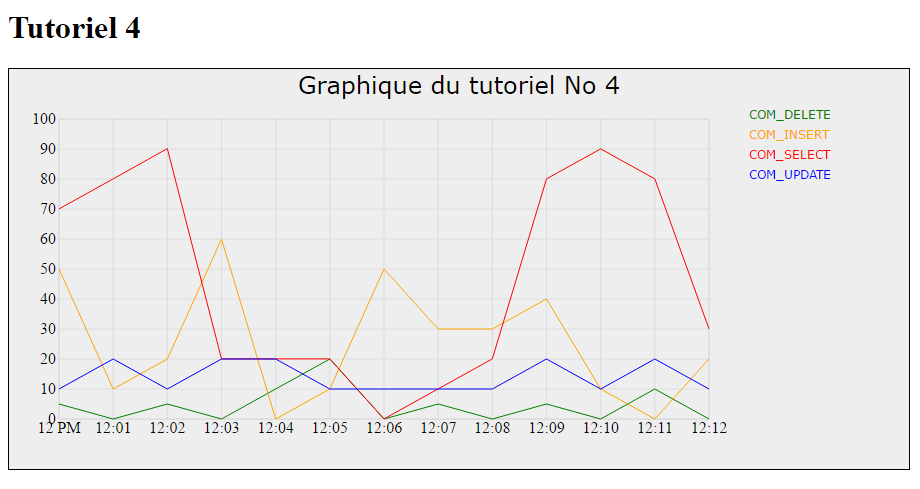
Tutoriel 4 : Graphique Lignes Complet
Code
data.jstutoriel_04.htmldata = { "start" : 1459332000000, "end" : 1459332720000, "step" : 60000, "max" : 100.0, "names" : ["COM_DELETE", "COM_INSERT", "COM_SELECT", "COM_UPDATE"], "colors": ["green","orange","red","blue"], "values": [[5.000000, 0.000000, 5.000000, 0.000000, 10.000000, 20.000000, 0.000000, 5.000000, 0.000000, 5.000000, 0.000000, 10.000000, 0.000000], [50.000000, 10.000000, 20.000000, 60.000000, 0.000000, 10.000000, 50.000000, 30.000000, 30.000000, 40.000000, 10.000000, 0.000000, 20.000000], [70.033333, 80.033333, 90.133333, 20.033333, 20.033333, 20.033333, 0.033333, 10.033333, 20.033333, 80.033333, 90.033333, 80.033333, 30.033333], [10.000000, 20.000000, 10.000000, 20.000000, 20.000000, 10.000000, 10.000000, 10.000000, 10.000000, 20.000000, 10.000000, 20.000000, 10.000000]] };
<!DOCTYPE html>
<html>
<head>
  <script src="d3.v2.js"></script>
  <script src="data.js"></script>
  <style>
    .graph                { background-color: #eeeeee;
                            border: 1px solid black; }
    .axis line            { stroke: #dddddd; }
    .axis path            { stroke: #dddddd;
                            fill: none; }
    .title                { font-family: Verdana;
                            font-size: 24px; }
    .legend               { font-family: Verdana;
                            font-size: 12px; }
  </style>
</head>
<body>

<h1>Tutoriel 4</h1>
<div id="graph"></div>

<script>
  var graph;
  var wImage, hImage, wGraph, hGraph, marginLeft, marginBottom, marginTop, marginRight;
  var startDate, endDate;
  var yMin, yMax;
  var title;
  var i;
  var lineFunction, lines, linesGroup;

  wImage = 900;
  hImage = 400;
  marginLeft = 50;
  marginBottom = 50;
  marginTop = 50;
  marginRight = 200;
  wGraph = wImage - marginLeft - marginRight;
  hGraph = hImage - marginTop - marginBottom;
  title = "Graphique du tutoriel No 4";

  startDate = new Date(data.start);
  endDate = new Date(data.end);
  yMin = 0.0;
  yMax = data.max;

  // add graph
  graph = d3.select("#graph")
            .append("svg:svg")
            .attr("class", "graph")
            .attr("width", wImage)
            .attr("height", hImage)
            .append("svg:g");

  // Add the x-axis.
  xScale = d3.time.scale().domain([startDate, endDate]).range([0, wGraph]);
  xAxis = d3.svg.axis().scale(xScale).orient("bottom").tickSize(-hGraph);
  graph.append("svg:g")
       .attr("class", "axis")
       .attr("transform", "translate("+marginLeft+","+(marginTop+hGraph)+")")
       .call(xAxis);

  // Add the y-axis
  yScale = d3.scale.linear().domain([yMin, yMax]).range([hGraph, 0]);
  yAxis = d3.svg.axis().scale(yScale).orient("left").tickSize(-wGraph);
  graph.append("svg:g")
       .attr("class", "axis")
       .attr("transform", "translate("+marginLeft+","+marginTop+")")
       .call(yAxis);

  // create line function used to plot our data
  lineFunction = d3.svg.line()
                       .x(function(d,i) { return marginLeft + xScale(startDate.getTime() + (data.step*i)); })
                       .y(function(d,i) { return marginTop + yScale(d); })
                       .defined(function(d) { return d >= 0; });// handle missing data gracefully

  // append a group to contain all lines
  lines = graph.append("svg:g")
               .selectAll("path")
               .data(data.values); // bind the array of arrays

  // add a line group for each array of values (it will iterate the array of arrays bound to the data function above)
  linesGroup = lines.enter().append("g")
                            .attr("class", function(d, i) { return "line_group series_" + i; });

  // add path (the actual line) to line group
  linesGroup.append("path")
            .attr("class", function(d, i) { return "line series_" + i; })
            .attr("fill", "none")
            .attr("stroke", function(d, i) { return data.colors[i]; })
            .attr("d", lineFunction); // use the 'lineFunction' to create the data points in the correct x,y axi;

  // titre
  graph.append("text")
       .text(title)
       .attr("class", "title")
       .attr("x",wImage/2)
       .attr("text-anchor", "middle")
       .attr("y",marginTop/2)
       .attr("fill", "black");

  // legende
  for (i=0; i<data.names.length; i++) {
    graph.append("text")
         .text(data.names[i])
         .attr("class", "legend")
         .attr("x",wImage - marginRight + 40)
         .attr("y",marginTop+i*20)
         .attr("fill", data.colors[i]);
  }
</script>

</body>
</html>
Résultat